Like you’re five? That’s gonna be tough with Arcade, but let’s try! I’ll probably be vastly oversimplifying certain things.
Esri does have their example which I assume you found, but that expression hasn’t been updated much over the years, and there are better ways to write these things.
As @AdamAull mentioned, you’re definitely gonna need a Data Expression to break out your values into a nice pie chart.
FeatureSets
Dashboard widgets want FeatureSets. For our purposes here, a FeatureSet is the same as a table. I’ll use table terms, if that helps.
It’s going to look all JavaScript-y with curly braces, but in the end, it’s a table.
Your widget, a chart in this case, wants columns and rows.
Packed Values
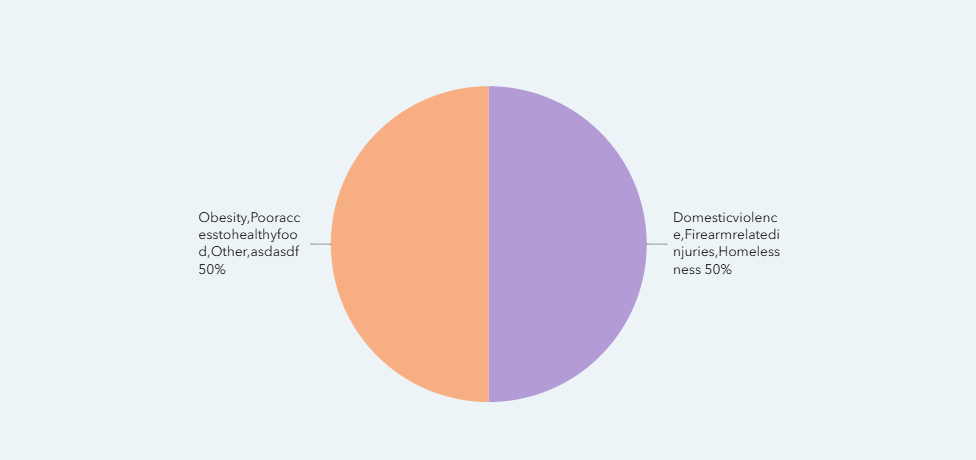
Your survey responses pack multiple values into a single cell of the table. We know that there are multiple things in there, but the Dashboard doesn’t. It sees two rows, that’s all it can use.
To split this out into a nice pie chart, we need each of those values in their own row of the table.
Data Expressions
In a Dashboard, we can create what’s known as “Data Expressions”. Think of it as “building a table from scratch”.
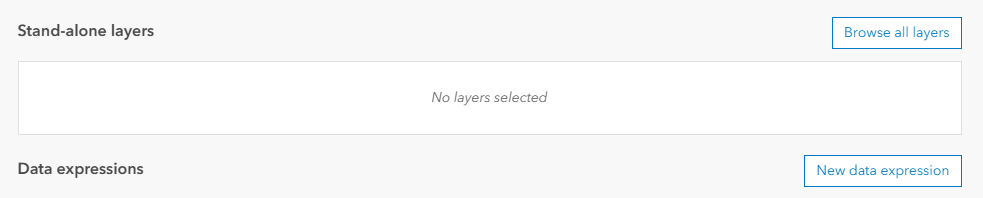
When you create a new widget, you have the option of using a data expression instead of an existing layer. You’re then given a big code entry space, and somehow need to get a table out of it.
Here are the steps:
- Load some data
- Define the columns of your table
- Fill in the rows of your table
Load Data
We use the FeatureSetByPortalItem function to load your layer:
var fs = FeatureSetByPortalItem(
  Portal('your-portal-url'),
  'itemid of your layer',
  0, // layer index. usually 0, but check your layer to be certain
  ['list', 'of', 'fields'], // you only need to list off the fields you *need*
  false // you will rarely need the geometry, best set to false
)
Define columns
To get your expression to spit out a table, you’ve got to get things formatted just right. Start with a dictionary like this:
var out_dict = {
  features: [],
  geometryType: '',
  fields: [{ name: 'answers', type: 'esriFieldTypeString' }]
}
On the line starting fields, that’s where we define the columns by listing off the column name and its type. Your pie chart really only needs a single column to store individual responses from the survey.
Fill in rows
As of right now, our output table is still empty. We need to break apart those answers from the original table.
To get the attributes of each feature, we have to step into each feature on at a time. In Arcade, we do that with a for loop. Whatever we put inside this loop happens for every row in our original table.
for (var f in fs) {
  // do something with the feature
}
Earlier, we created our empty “table”. The features array is what our “rows” are. There’s nothing in it, but the function Push can be used to add things to an array.
So, inside this loop, we will:
- Break up the answers into individual values
Push the values into our output table
Breaking Up Values
Your survey separates the answers with a , character. In Arcade, the function Split can break a text value at specific characters, giving us an array of individual answers.
Split('one,two,three', ',') → ['one', 'two', 'three']
Looping over an array
To get at each value inside that array, you need another loop. But looping over an array is a little different than looping over your features.
We’re getting into “precocious five year old” territory, but I want to make it clear why the two loops look different.
When I say for (var x in object){…},
object is a FeatureSet |
object is an array |
x is a Feature. You can use x directly to access the feature and its values. |
x is a number corresponding to a position in the array. You have to access the array by index, object[x], to actually pull out the value. |
Feature Structure
When you’re building a FeatureSet yourself, a Feature is built as a Dictionary consisting of field-value pairs, like this:
{ attributes: {
  field1: 'some text',
  field2: 123.45
  field3: 10
}}
Okay, back to the actual code
So, to break up the answers and put them into our table, it would look like:
for (var f in fs) {
  var answers = Split(f['your_question_field'], ',')
  for (var a in answers) {
    Push(out_dict['features'], {{attributes:{answer:answers[a]}})
  }
}
Let’s Put it All Together
Here’s everything in a single code block. Swap in your attributes and itemIDs, etc., and see what it does.
// load your features
var fs = FeatureSetByPortalItem(
  Portal('your-portal-url'),
  'itemid of your layer',
  0, // layer index. usually 0, but check your layer to be certain
  ['list', 'of', 'fields'], // you only need to list off the fields you *need*
  false // you will rarely need the geometry, best set to false
)

// output table
var out_dict = {
  features: [],
  geometryType: '',
  fields: [{ name: 'answers', type: 'esriFieldTypeString' }]
}

// loop over features
for (var f in fs) {

  // break answers by comma
  var answers = Split(f['your_question_field'], ',')

  // for each answer, push it to the output table
  for (var a in answers) {
    Push(out_dict['features'], {{attributes:{answer:answers[a]}})
  }
}

// return the output
return FeatureSet(out_dict)
The results should be able to go straight into a Pie Chart. Set it to Grouped Values and choose the field answer. Done!