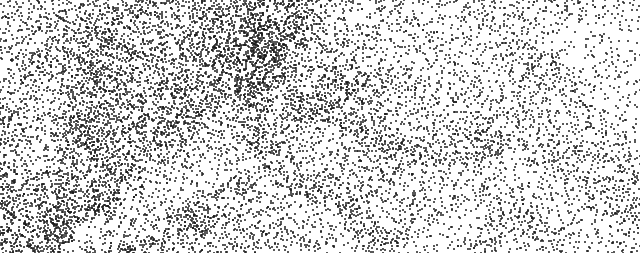
Day 1!
Details
flowchart TD

1[30 M DEM]
2[5 km hex bins]
3[Zonal statistics]
4[Symbolize by range]

1 & 2 --> 3 --> 4
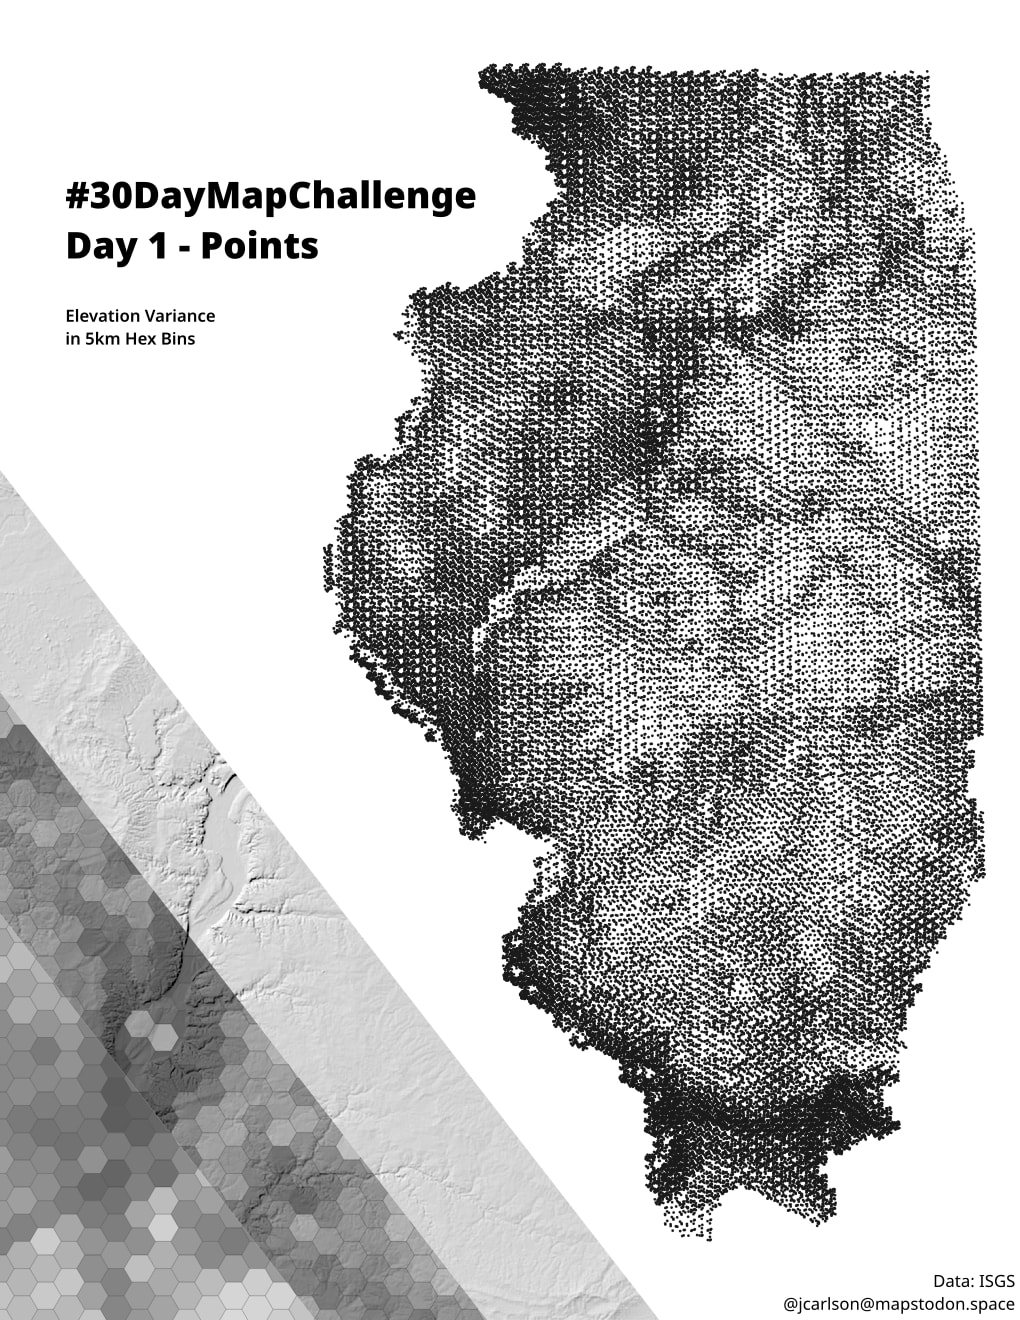
In the statewide map, the symbology of the hex bins is set to QGIS’s Random Marker Fill and Absolute Count. The count of dots in each hex bin is the elevation range of that bin divided by 10.
Not an elevation map, or even a hillshade. More like an extremely coarse ruggedness index?
Fun accidental effect: all bins use the same seed for the random point placement. Random within a hexagon, but the same across all hexagons. Creates some interesting repeating patterns.
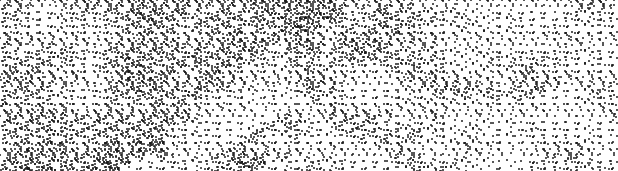
Interestingly, with each hexagon taking a different seed, the landscape is harder to discern.